Benford's law is the observation that in many numerical datasets, the distribution of leading digits is not uniform—the first digit of any number in the dataset is much more likely to be a 1 than a 9 (30.1% vs 4.6% for numbers in base-10).
Here's a plot for the expected frequencies for digits from 1 to 9 for base-10 numbers:
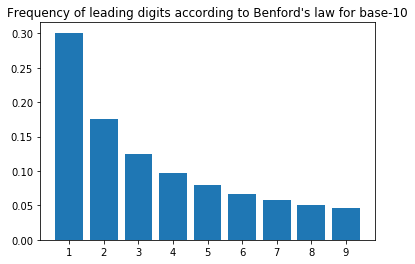
These expected frequencies can be calculated for any base with the formula log_b(1 + 1/d) where b represents the base and d is a digit in [1, b).
Many real world datasets can be empirically shown to follow Benford's law, from naturally occuring data such as physical constants or lengths of rivers, to human data such as population or GDP. Check out the website Testing Benford's Law for some examples:
Testing Benford's LawAn experiment to test Benford's Law against large, publicly available datasets.http://www.testingbenfordslaw.com/
In fact, when data instead does not follow Benford's law, it's often reason enough to doubt the authenticity of the data. One commonly cited application of Benford's law is in detecting accounting fraud—if the figures in financial statements aren't consistent with Benford's law, they could have been misrepresented.
More recently, Benford's law has been used to detect suspicious activity on social networks such as Facebook and Twitter:
Benford’s Law Applies to Online Social NetworksBenford's Law states that, in naturally occurring systems, the frequency of numbers' first digits is not evenly distributed.http://journals.plos.org/plosone/article?id=10.1371/journal.pone.0135169
How Benford's Law Reveals Suspicious Activity on TwitterThe counterintuitive distribution of digits in certain data sets turns out to be a powerful tool for detecting strange behavior on social networks.https://www.technologyreview.com/s/536906/how-benfords-law-reveals-suspicious-activity-on-twitter/
Back to Reddit
Some time ago, I was playing with Reddit's API and wrote about generating new Reddit comments from existing ones using Markov chains. This time, I decided to test if the scores and number of comments on Reddit submissions were consistent with Benford's law.
Reproducibility
I based my analysis on the current Reddit submissions in r/all across the 6 available categories: hot, new, rising, controversial, top and gilded, downloaded fresh from the Reddit API using PRAW, so running the same analysis again will use different data and possibly give different results.
Nevertheless, you can find the code and data I used for the analysis in this blog post in the appendix.
I had originally hoped to use an existing dump of Reddit data from pushshift.io for reproducibility, but after some experimentation decided against it for two reasons:
- Size: Reddit monthly dumps are quite big, around 2 to 3 gigabytes per month since 2016. Far from impossible to handle, but slightly inconvenient.
- Age: The submissions in the daily dumps were at most a day old, and didn't vary enough in score and number of comments to provide interesting results. (I didn't try using the monthly dumps because of the previous reason.)
Results
At a glance, it looks like most—but not all—of our data fits with Benford's law:
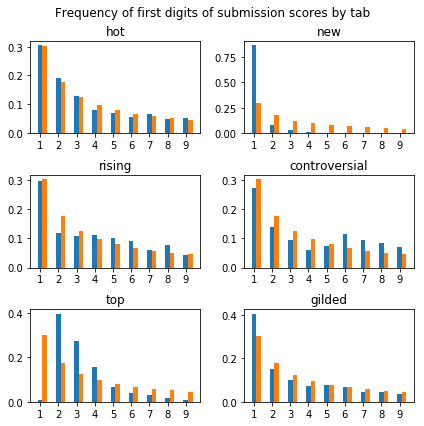
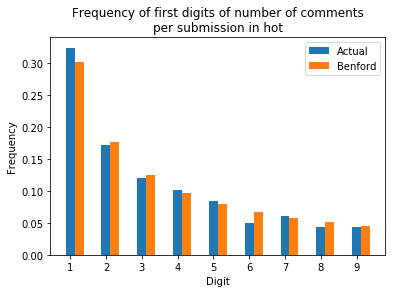
Submissions from the “hot” tab in particular fit exceptionally well:

Submissions from the “new” tab have a disproportionate amount of leading 1s. This probably has something to do with new submissions starting out with a score of 1, and 0 comments.


The graph for top submissions looks like it was shifted to the right, with 2 becoming the most common digit instead of 1:
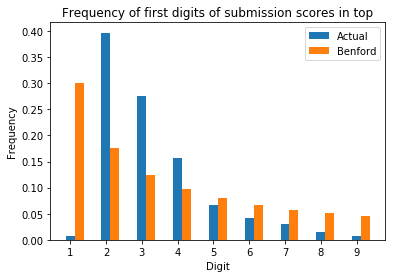
This graph was plotted with the weekly top submissions to follow the default behavior on the web at https://www.reddit.com/r/all/top/. If we use the all time top submissions instead, we observe the following graph:
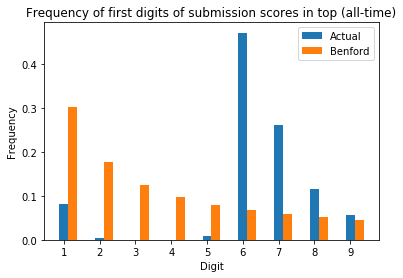
This time, it seems to be shifted until the most common digit is 6 instead of 1!
My guess is that this happens because top submissions follow a truncated distribution: only submissions with a score above a certain threshold are counted as top submissions. The minimum score for weekly and all time top submissions in this case are 21954 and 59670 respectively. From the histogram for the score distribution for weekly and all time top submissions, it looks like most of the top submissions are close to the minimum score:
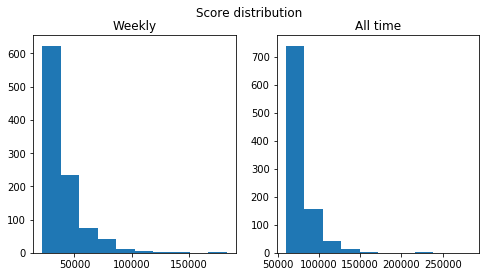
So it just happens that most of the top submissions have scores starting with 2 for the week and 6 for all time.
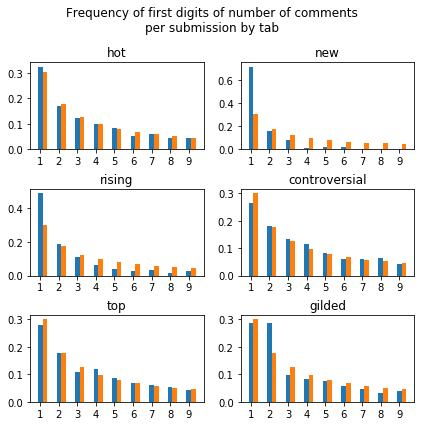
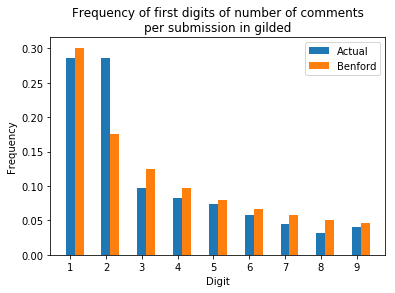
Finally, the frequency of 1 and 2 as a first digit for the number of comments on gilded submissions are similar. I don't have an explanation for this though.
Appendix
- Code (as a Jupyter notebook): https://gist.github.com/yi-jiayu/89d5530b693dcde89fdfa9d4dd421863
- Data used in this blog post (in CSV format): https://gist.github.com/yi-jiayu/bc598392068253cffc63450811765217