VisiData is a quick way to run simple queries on CSV data without having to load the data into a database or use R, Python or Excel.
We can find a resale flat prices dataset on Data.gov.sg. It contains transaction data over multiple time periods in CSV format:
$ wget --content-disposition https://data.gov.sg/dataset/7a339d20-3c57-4b11-a695-9348adfd7614/download
$ unzip -d resale-flat-prices resale-flat-prices.zip
$ cd resale-flat-prices
$ exa
metadata-resale-flat-prices.txt
resale-flat-prices-based-on-approval-date-1990-1999.csv
resale-flat-prices-based-on-approval-date-2000-feb-2012.csv
resale-flat-prices-based-on-registration-date-from-jan-2015-to-dec-2016.csv
resale-flat-prices-based-on-registration-date-from-jan-2017-onwards.csv
resale-flat-prices-based-on-registration-date-from-mar-2012-to-dec-2014.csv
We'll focus on the most recent data contained in resale-flat-prices-based-on-registration-date-from-jan-2017-onwards.csv. To open the file in VisiData:
vd resale-flat-prices-based-on-registration-date-from-jan-2017-onwards.csv
Median price by town and flat type
- Use the left and right arrow keys or
HandLto navigate between columns. - Navigate to the
towncolumn and press!to set it as the row label. - Navigate to the
resale_pricecolumn and press#to mark it as a numeric column. - With the
resale_pricecolumn still selected, press+to choose an aggregation, then typemedianand press enter. - Navigate to the
flat_typecolumn and pressShift+Wto generate a pivot table with it as the column label. - In the generated pivot table, press
[or]with a column selected to sort by that column.
The end result and the process of getting there:
Price by floor area and flat type
VisiData can also generate colourful scatter plots:

Starting from a fresh instance of our data in VisiData:
- Navigate to the
floor_area_sqmcolumn and press#to mark it as numerical, then!to set it as a key column. - Navigate to the
flat_typecolumn and press!to mark it as a second key column. - Navigate to the
resale_pricecolumn and press#to mark it as numerical, then press.to generate the scatter plot.
Median price by floor and flat type
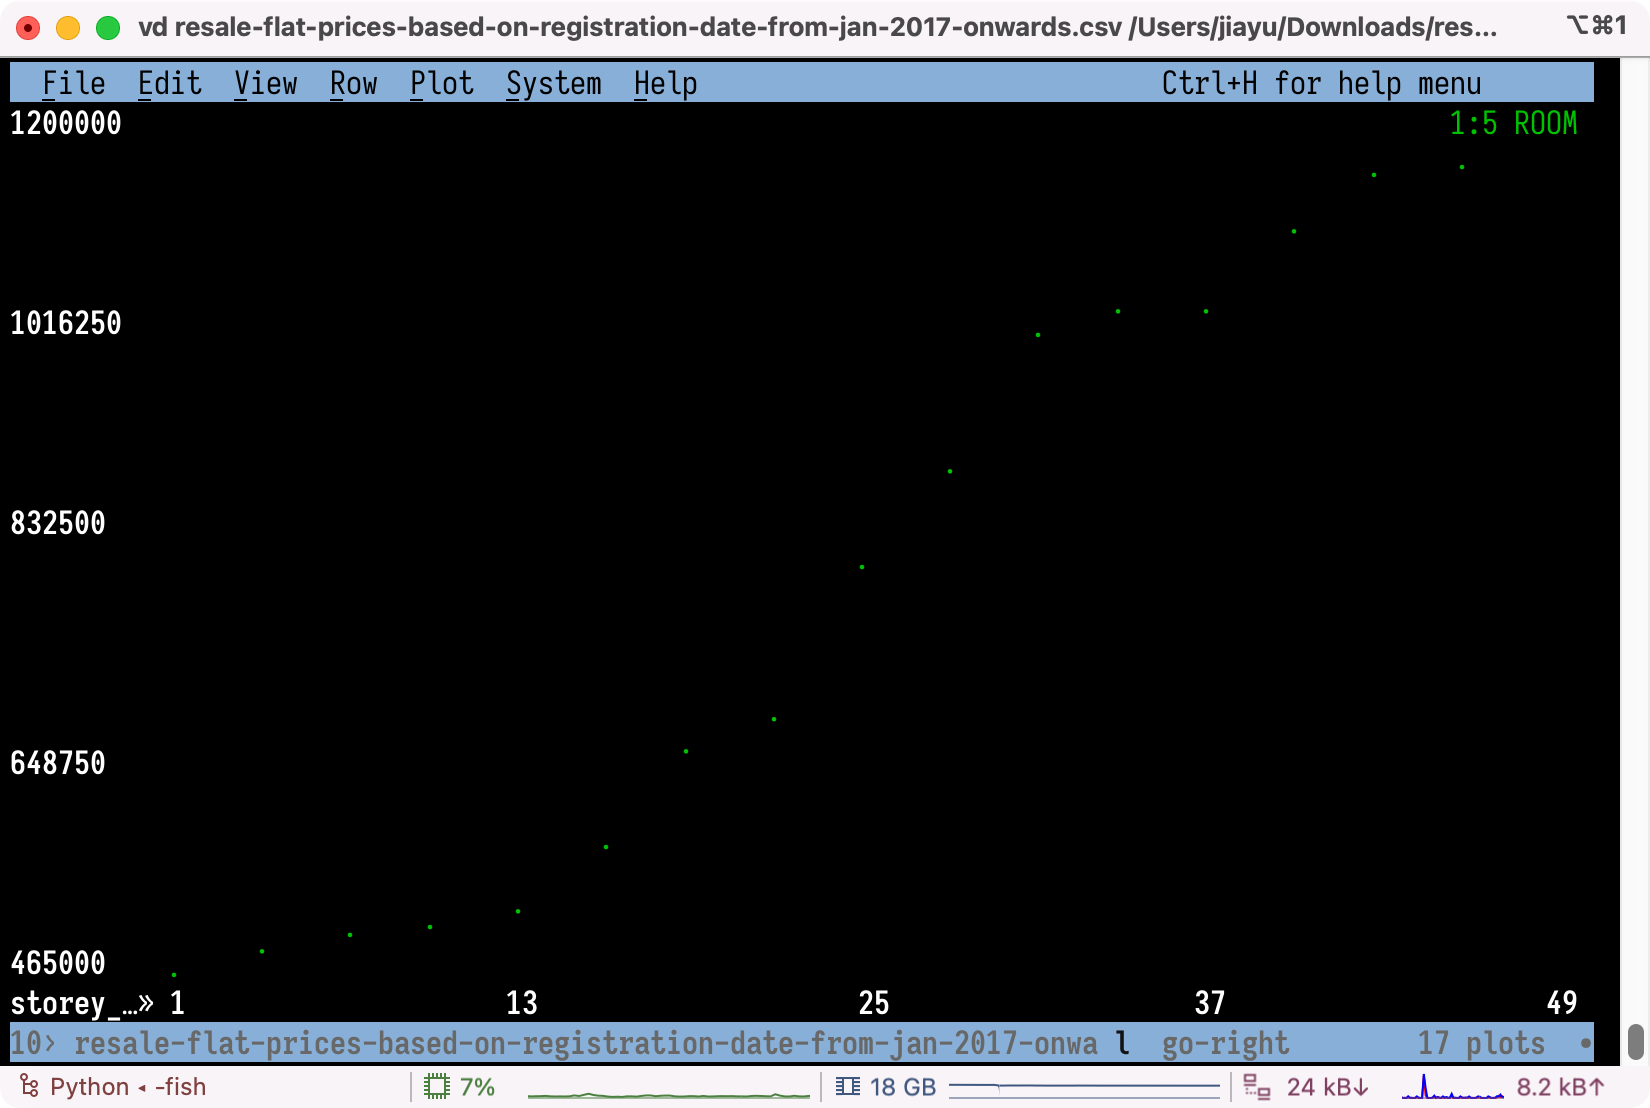
We can use derived columns when the raw data in a column is not in an appropriate format. For example, the storey_range column contains values like 01 TO 03 or 10 TO 12, which is not properly numeric, so we cannot use it directly. Instead, we can create a new column derived from it containing just the lower bound of the range.
Starting from a fresh instance of our data:
- Press
=to create a new column, then typestorey_range[:2]and press enter. This will be evaluated as a Python expression, creating a new column containing the first two characters of thestorey_rangecolumn. - Navigate to the new
storey_range[:2]column and press#to mark it as a numeric column, then press!to use it as the row label. - Navigate to the
resale_pricecolumn and press#to mark it as numerical, then press+to add an aggregation and type inmedianand press enter. - Navigate to the
flat_typecolumn and pressShift+Wto generate a pivot table with it as the column label. - In the generated pivot table, press
[or]on any column to sort by that column, or press.to view a scatter plot of just that column.
Animated example:
Scatter plot:
