On the Rain Areas page at the Meteorological Service Singapore website, you can see exactly where it's raining in Singapore at the moment:
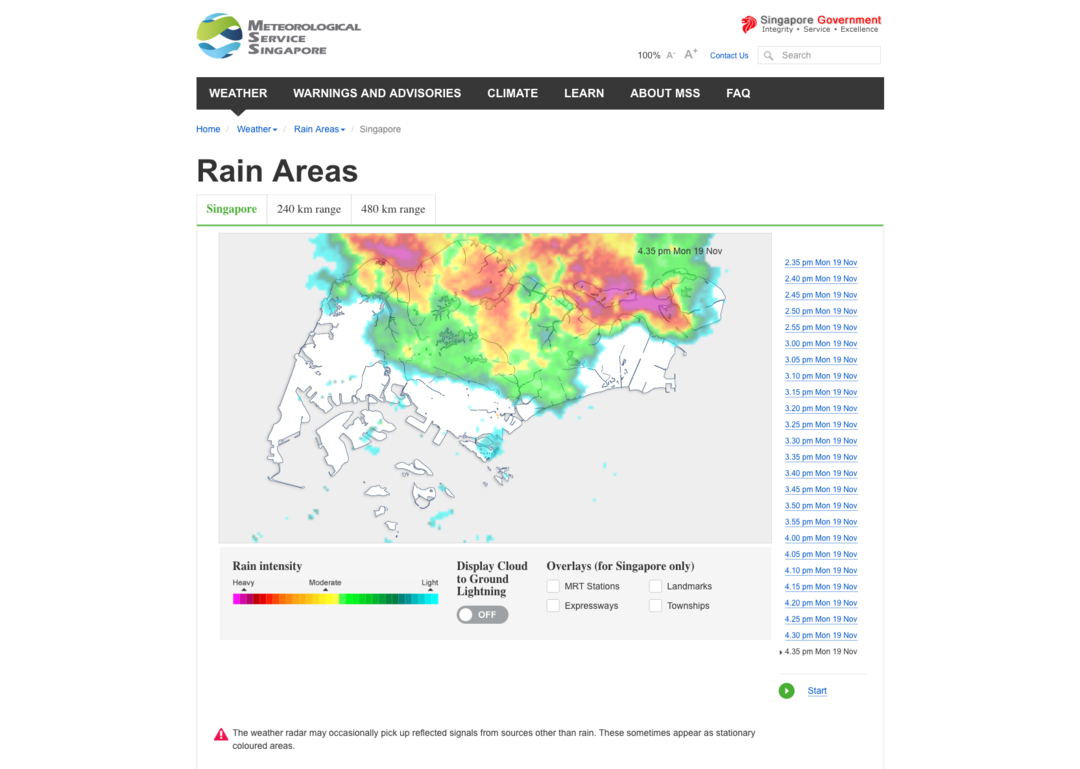
The page is updated at five-minute intervals. It's useful for determining whether it'll start raining soon—it's more likely if it's already raining in your immediate vicinity.
You can also view the rain areas over the past hour, which lets you estimate how fast the rain clouds are moving:
And sometimes it's just fascinating to see how rainy it gets in Singapore:
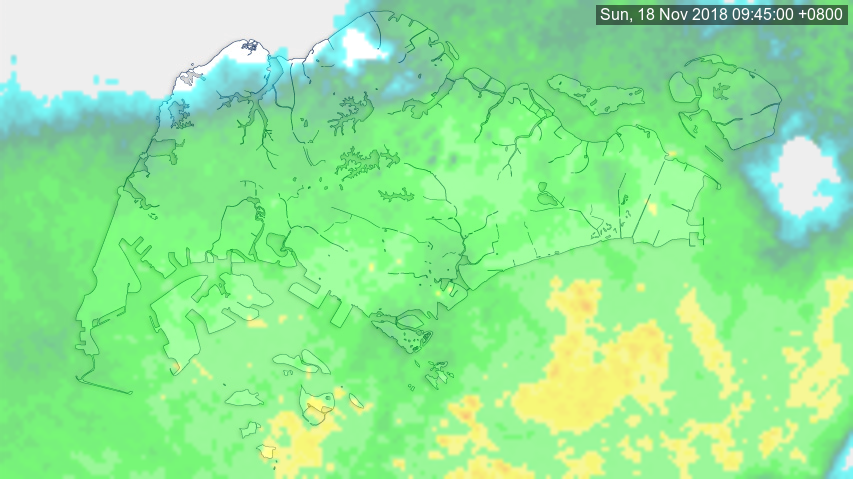
Light rain across the entire country
This is a nice shareable image of the rain areas from last Sunday morning. However, it's not something you can get directly from the website—the next section explains why. Later, we'll see how we can go about creating it ourselves.
Under the hood
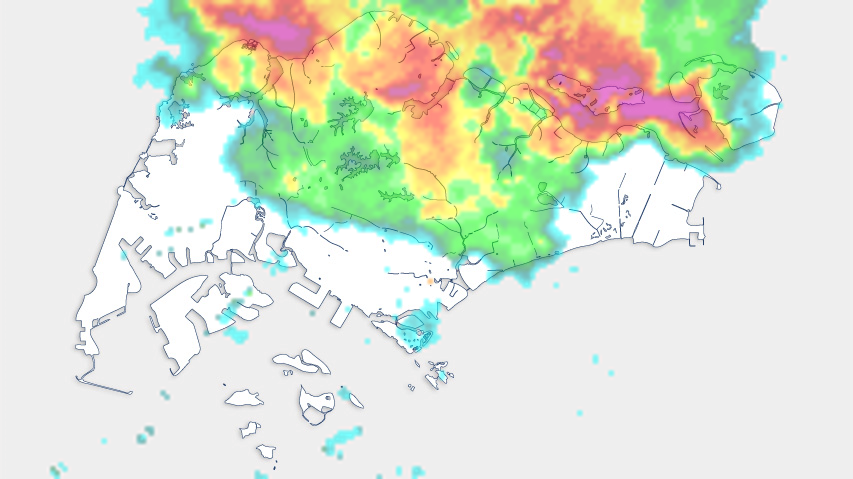
The rain areas aren't displayed on the website as an image that can be directly viewed or downloaded—it's actually a combination of a static background image containing the map, and a smaller image containing the radar data overlaid over it:
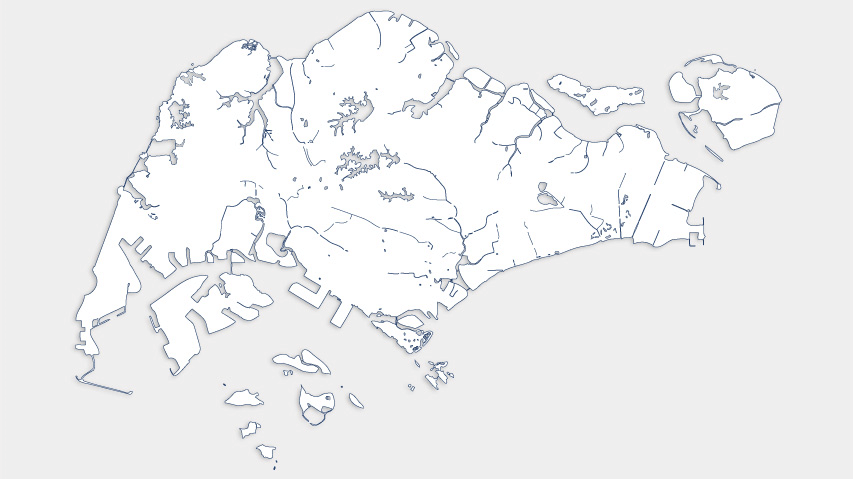
base-853.png

dpsri_70km_2018111916350000dBR.dpsri.png
The two images and the timestamp are then lined up in HTML and displayed by the browser. As a result, you can find both images on the page separately, but the end result you see only exists on the website.
Doing it ourselves
The most straightforward solution would be to just take a screenshot of the website and share that. One could possibly automate the process by using a headless browser and taking a screenshot of that instead. Or perhaps try something even more sophisticated like rendering the DOM to an image with a tool like dom-to-image.
However, my own method was to download both images separately and combine them, along with the timestamp, using ImageMagick.
Preparing the images
The base image has a static URL that we can download it from:
$ wget -O base.png https://www.weather.gov.sg/wp-content/themes/wiptheme/assets/img/base-853.png
The radar overlays contain a timestamp in their names, in the format yyyyMMddHHmm. For example, the overlay from this Monday, the 19th of November at 4.35 pm in the afternoon can be found and downloaded like so:
$ wget -O overlay.png https://www.weather.gov.sg/files/rainarea/50km/v2/dpsri_70km_2018111916350000dBR.dpsri.png
These two commands download the base map to base.png and the radar overlay to overlay.png:
$ tree
.
├── base.png
└── overlay.png

0 directories, 2 files
ImageMagick in action
composite can be used to overlap one image over another. We will use it to superimpose the radar overlay onto our base map:
$ composite \
    overlay.png \
    base.png \
    -geometry 853x479! \
    -blend 50 \
    overlaid.png
-
The
-geometryflag resizes the overlay, which is smaller than the base map, to the same size as the base map. The exclamation mark behind the height and width tells ImageMagick to ignore the original aspect ratio and just set it to the given size. -
The
-blendflag sets the opacity of the overlay to 50%, so that we can see through it.
You can read more about composing images with ImageMagick here.
This gives us the following result:
Next, we'll add the timestamp to the image using convert. convert converts images between different formats as its name goes, but can also apply a range of transformations along the way, including adding text to an image.
$ convert overlaid.png \
    -fill white \
    -undercolor '#00000080' \
    -gravity NorthEast \
    -pointsize 16 \
    -annotate +5+5 "\ Tue, 19 Nov 2018 16:35:00 +0800 " \
    timestamped.png
-
The
-filloption sets the colour of the text we are adding to our image. -
The
-undercoloroption sets the background colour of the bounding box of the text we are adding. -
The
-gravityoption allows us to specify a relative position for the text we are adding, with reference to the image. In this case,NorthEastmeans that our text will be placed in the top-right corner. -
The
-pointsizeoption is the font size of the text we are adding. -
The
-annotateoption is where the real work is being done.+5+5is an offset for the text we are adding and is affected by the-gravityvalue. In this case, our text will be 5 pixels closer to the center of the image from the top-right corner. -
The next argument to
-annotateis the actual text to be added. In this case it is the RFC 1123-compliant timestamp of the radar overlay. The backslash causes the leading space to be included in the added text, creating a bit more space in the bounding box. The trailing space is there for the same reason, but does not need to be escaped.
You can read more about annotating images with ImageMagick here.
Here is the final result with a timestamp:
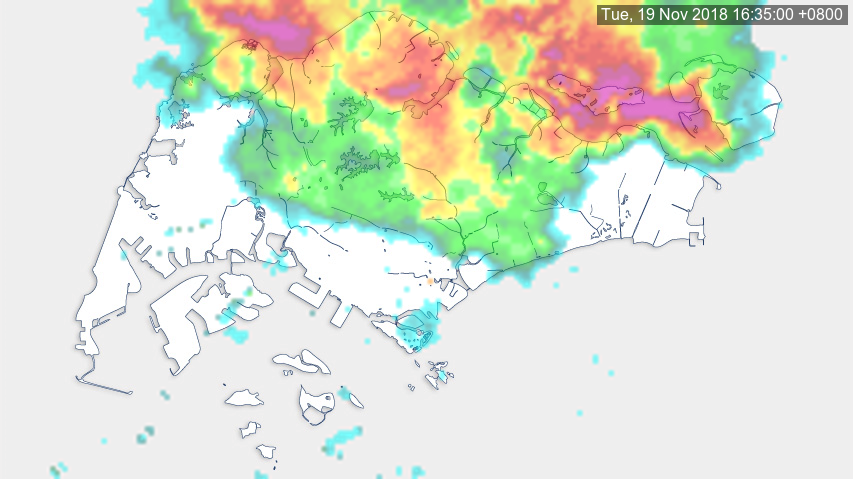
You can find a comprehensive list of ImageMagick command-line options here.
Final thoughts
I've really liked the rain areas map since I first found out about it, and had thought about making it more shareable for a long time. I even contacted the MSS by email two years ago to make a feature request for rain areas to be included in the National Environment Agency's weather related APIs instead of just being viewable in the browser, however there were no plans for that.
As a proof of concept, and an experiment in building a Clojure application, I made a Telegram bot and website for getting the latest rain areas as an image:
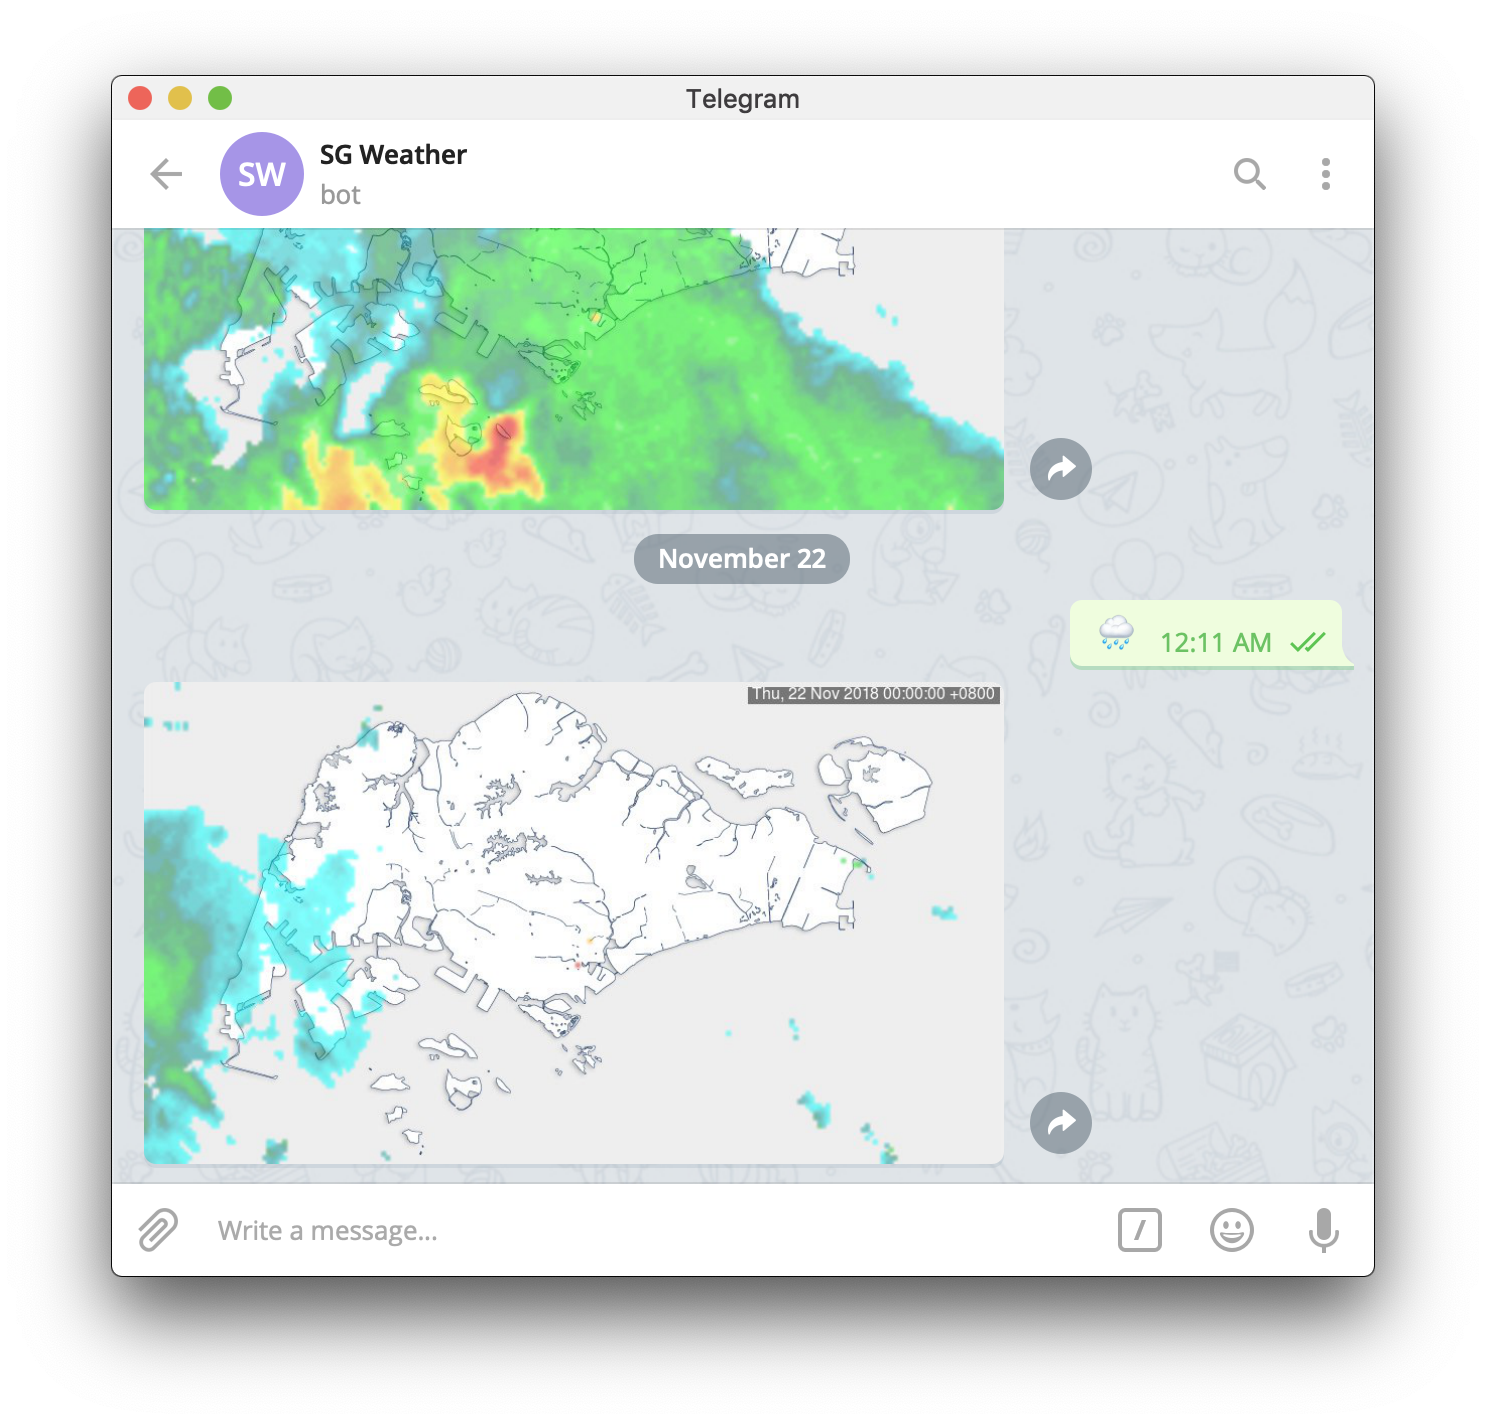
Rain areasRain areashttps://weathersg-bot.jiayu.io/rain-areas
Its source code can be found on GitHub:
yi-jiayu/weathersg-botweathersg-bothttps://github.com/yi-jiayu/weathersg-bot